文章目录
- 自己上次安装好PyTorch以及训练了一下官方的数据,今天看到了这个TensorBoard来可视化的用法,感觉不错就尝试玩了一下!自己只是尝试了一下追踪模型训练的过程,其他自己去看官网教程吧!
- 具体详细说明请参考https://pytorch.org/tutorials/intermediate/tensorboard_tutorial.html 简单说就是: 设置TensorBoard。 写入TensorBoard。 运行 打开http://localhost:6006/
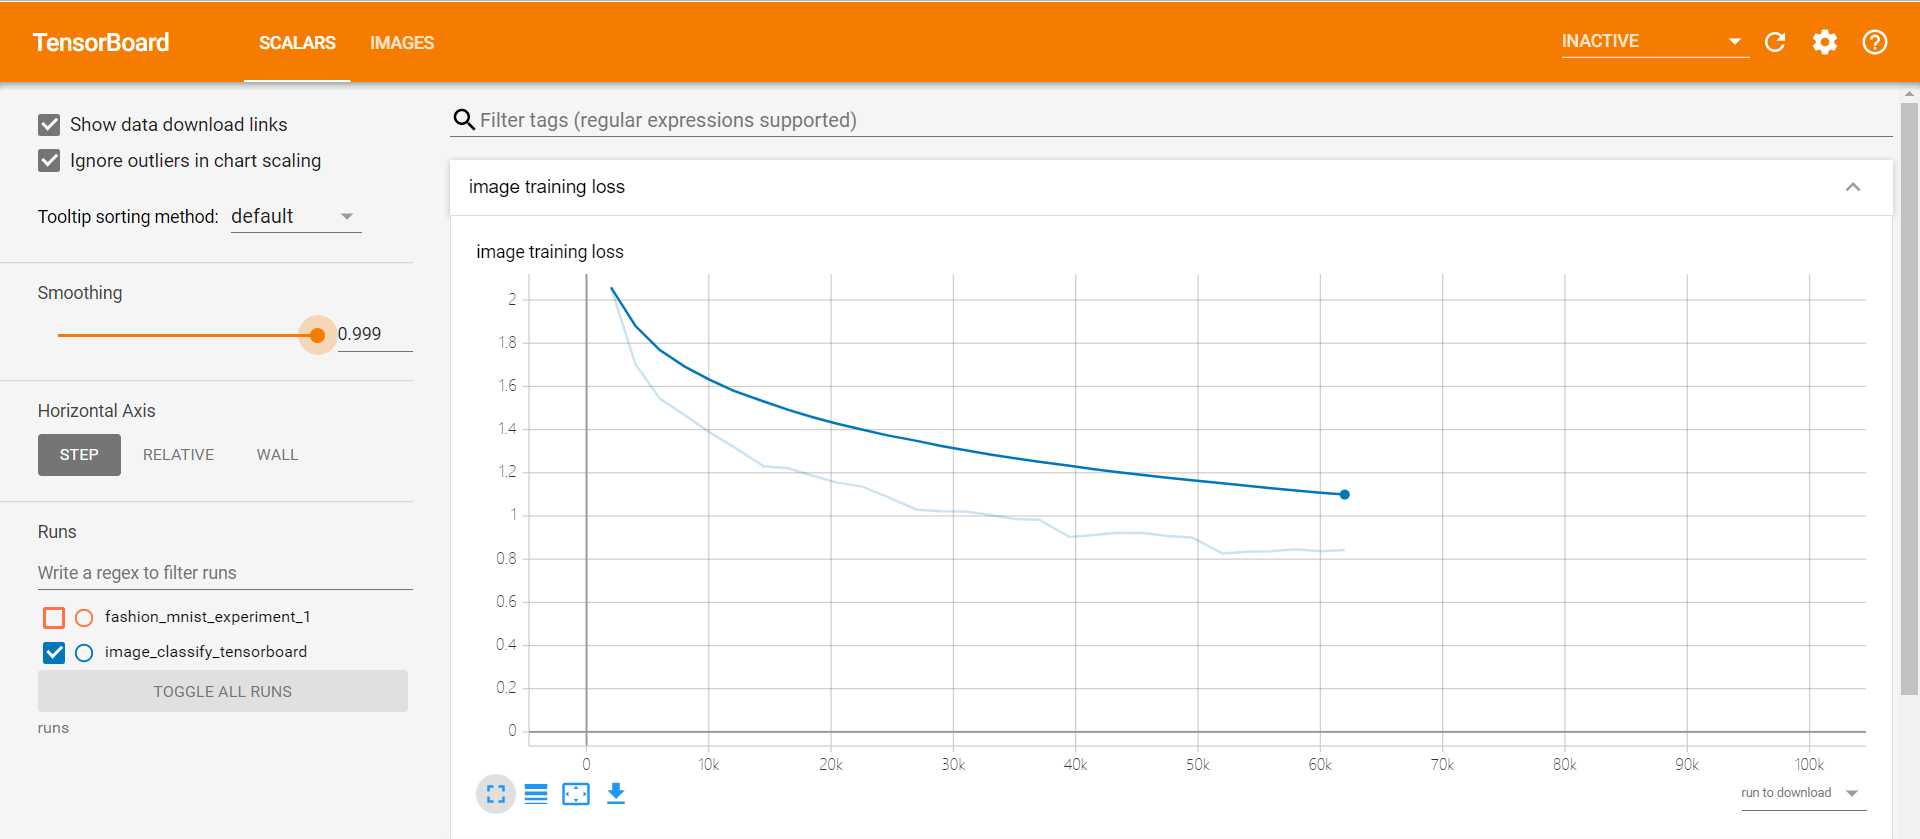
- 我把训练的图片分类的loss用tensorboard给可视化出来了:
- 设置TensorBoard。 简单说是设置基本tensorboard运行需要的东西,我这代码中的imshow(img)和matplotlib_imshow(img, one_channel=False)都是显示图片的函数,可以统一替换,我自己测试就没改了! # helper function to show an image # (used in the `plot_classes_preds` function below) def matplotlib_imshow(img, one_channel=False): if one_channel: img = img.mean(dim=0) img = img / 2 + 0.5 # unnormalize npimg = img.cpu().numpy() if one_channel: plt.imshow(npimg, cmap="Greys") else: plt.imshow(np.transpose(npimg, (1, 2, 0))) # 设置tensorBoard # default `log_dir` is "runs" - we'll be more specific here writer = SummaryWriter('runs/image_classify_tensorboard') # get some random training images dataiter = iter(trainloader) images, labels = dataiter.next() # create grid of images img_grid = torchvision.utils.make_grid(images) # show images # matplotlib_imshow(img_grid, one_channel=True) imshow(img_grid) # write to tensorboard writer.add_image('imag_classify', img_grid) # Tracking model training with TensorBoard # helper functions def images_to_probs(net, images): ''' Generates predictions and corresponding probabilities from a trained network and a list of images ''' output = net(images) # convert output probabilities to predicted class _, preds_tensor = torch.max(output, 1) # preds = np.squeeze(preds_tensor.numpy()) preds = np.squeeze(preds_tensor.cpu().numpy()) return preds, [F.softmax(el, dim=0)[i].item() for i, el in zip(preds, output)] def plot_classes_preds(net, images, labels): ''' Generates matplotlib Figure using a trained network, along with images and labels from a batch, that shows the network's top prediction along with its probability, alongside the actual label, coloring this information based on whether the prediction was correct or not. Uses the "images_to_probs" function. ''' preds, probs = images_to_probs(net, images) # plot the images in the batch, along with predicted and true labels fig = plt.figure(figsize=(12, 48)) for idx in np.arange(4): ax = fig.add_subplot(1, 4, idx+1, xticks=[], yticks=[]) matplotlib_imshow(images[idx], one_channel=True) ax.set_title("{0}, {1:.1f}%\n(label: {2})".format( classes[preds[idx]], probs[idx] * 100.0, classes[labels[idx]]), color=("green" if preds[idx]==labels[idx].item() else "red")) return fig 写入TensorBoard。 这个在训练的每一阶段写入tensorboard if i % 2000 == 1999: # print every 2000 mini-batches print('[%d, %5d] loss: %.3f' % (epoch + 1, i + 1, running_loss / 2000)) # 把数据写入tensorflow # ...log the running loss writer.add_scalar('image training loss', running_loss / 2000, epoch * len(trainloader) + i) # ...log a Matplotlib Figure showing the model's predictions on a # random mini-batch writer.add_figure('predictions vs. actuals', plot_classes_preds(net, inputs, labels), global_step=epoch * len(trainloader) + i) 运行 tensorboard --logdir=runs 打开http://localhost:6006/ 即可查看
- import torch import torchvision import torchvision.transforms as transforms import matplotlib.pyplot as plt import numpy as np import torch.nn as nn import torch.nn.functional as F import torch.optim as optim from datetime import datetime from torch.utils.tensorboard import SummaryWriter PATH = './cifar_net_100.pth' # 保存模型地址 transform = transforms.Compose( [transforms.ToTensor(), transforms.Normalize((0.5, 0.5, 0.5), (0.5, 0.5, 0.5))]) trainset = torchvision.datasets.CIFAR10(root='./data', train=True, download=True, transform=transform) trainloader = torch.utils.data.DataLoader(trainset, batch_size=4, shuffle=True, num_workers=0) testset = torchvision.datasets.CIFAR10(root='./data', train=False, download=True, transform=transform) testloader = torch.utils.data.DataLoader(testset, batch_size=4, shuffle=False, num_workers=0) classes = ('plane', 'car', 'bird', 'cat', 'deer', 'dog', 'frog', 'horse', 'ship', 'truck') device = torch.device("cuda:0" if torch.cuda.is_available() else "cpu") # Assuming that we are on a CUDA machine, this should print a CUDA device: print(device) print("获取一些随机训练数据") # get some random training images dataiter = iter(trainloader) images, labels = dataiter.next() # functions to show an image def imshow(img): img = img / 2 + 0.5 # unnormalize npimg = img.numpy() plt.imshow(np.transpose(npimg, (1, 2, 0))) plt.show() # helper function to show an image # (used in the `plot_classes_preds` function below) def matplotlib_imshow(img, one_channel=False): if one_channel: img = img.mean(dim=0) img = img / 2 + 0.5 # unnormalize npimg = img.cpu().numpy() if one_channel: plt.imshow(npimg, cmap="Greys") else: plt.imshow(np.transpose(npimg, (1, 2, 0))) # show images imshow(torchvision.utils.make_grid(images)) # print labels print(' '.join('%5s' % classes[labels[j]] for j in range(4))) print("**********************") class Net(nn.Module): def __init__(self): super(Net, self).__init__() self.conv1 = nn.Conv2d(3, 100, 5) self.pool = nn.MaxPool2d(2, 2) self.conv2 = nn.Conv2d(100, 16, 5) self.fc1 = nn.Linear(16 * 5 * 5, 120) self.fc2 = nn.Linear(120, 84) self.fc3 = nn.Linear(84, 10) def forward(self, x): x = self.pool(F.relu(self.conv1(x))) x = self.pool(F.relu(self.conv2(x))) x = x.view(-1, 16 * 5 * 5) x = F.relu(self.fc1(x)) x = F.relu(self.fc2(x)) x = self.fc3(x) return x net = Net() net.to(device) # 训练 print("训练") criterion = nn.CrossEntropyLoss() optimizer = optim.SGD(net.parameters(), lr=0.001, momentum=0.9) # 设置tensorBoard # default `log_dir` is "runs" - we'll be more specific here writer = SummaryWriter('runs/image_classify_tensorboard') # get some random training images dataiter = iter(trainloader) images, labels = dataiter.next() # create grid of images img_grid = torchvision.utils.make_grid(images) # show images # matplotlib_imshow(img_grid, one_channel=True) imshow(img_grid) # write to tensorboard writer.add_image('imag_classify', img_grid) # Tracking model training with TensorBoard # helper functions def images_to_probs(net, images): ''' Generates predictions and corresponding probabilities from a trained network and a list of images ''' output = net(images) # convert output probabilities to predicted class _, preds_tensor = torch.max(output, 1) # preds = np.squeeze(preds_tensor.numpy()) preds = np.squeeze(preds_tensor.cpu().numpy()) return preds, [F.softmax(el, dim=0)[i].item() for i, el in zip(preds, output)] def plot_classes_preds(net, images, labels): ''' Generates matplotlib Figure using a trained network, along with images and labels from a batch, that shows the network's top prediction along with its probability, alongside the actual label, coloring this information based on whether the prediction was correct or not. Uses the "images_to_probs" function. ''' preds, probs = images_to_probs(net, images) # plot the images in the batch, along with predicted and true labels fig = plt.figure(figsize=(12, 48)) for idx in np.arange(4): ax = fig.add_subplot(1, 4, idx+1, xticks=[], yticks=[]) matplotlib_imshow(images[idx], one_channel=True) ax.set_title("{0}, {1:.1f}%\n(label: {2})".format( classes[preds[idx]], probs[idx] * 100.0, classes[labels[idx]]), color=("green" if preds[idx]==labels[idx].item() else "red")) return fig startTime = datetime.now() for epoch in range(5): # loop over the dataset multiple times running_loss = 0.0 for i, data in enumerate(trainloader, 0): # get the inputs; data is a list of [inputs, labels] # inputs, labels = data inputs, labels = data[0].to(device), data[1].to(device) # zero the parameter gradients optimizer.zero_grad() # forward + backward + optimize outputs = net(inputs) loss = criterion(outputs, labels) loss.backward() optimizer.step() # print statistics running_loss += loss.item() if i % 2000 == 1999: # print every 2000 mini-batches print('[%d, %5d] loss: %.3f' % (epoch + 1, i + 1, running_loss / 2000)) # 把数据写入tensorflow # ...log the running loss writer.add_scalar('image training loss', running_loss / 2000, epoch * len(trainloader) + i) # ...log a Matplotlib Figure showing the model's predictions on a # random mini-batch writer.add_figure('predictions vs. actuals', plot_classes_preds(net, inputs, labels), global_step=epoch * len(trainloader) + i) running_loss = 0.0 torch.save(net.state_dict(), PATH) print('Finished Training') print("Time taken:", datetime.now() - startTime) print("***************************") #获取一些随机测试数据 print("获取一些随机测试数据") dataiter = iter(testloader) images, labels = dataiter.next() # print images imshow(torchvision.utils.make_grid(images)) print('GroundTruth: ', ' '.join('%5s' % classes[labels[j]] for j in range(4))) # 恢复模型并测试 net = Net() net.load_state_dict(torch.load(PATH)) outputs = net(images) _, predicted = torch.max(outputs, 1) print('Predicted: ', ' '.join('%5s' % classes[predicted[j]] for j in range(4))) print("**********************") print("输出训练得到的准确度") # 输出训练得到的准确度 correct = 0 total = 0 with torch.no_grad(): for data in testloader: images, labels = data outputs = net(images) _, predicted = torch.max(outputs.data, 1) total += labels.size(0) correct += (predicted == labels).sum().item() print('Accuracy of the network on the 10000 test images: %d %%' % ( 100 * correct / total)) class_correct = list(0. for i in range(10)) class_total = list(0. for i in range(10)) with torch.no_grad(): for data in testloader: images, labels = data outputs = net(images) _, predicted = torch.max(outputs, 1) c = (predicted == labels).squeeze() for i in range(4): label = labels[i] class_correct[label] += c[i].item() class_total[label] += 1 for i in range(10): print('Accuracy of %5s : %2d %%' % ( classes[i], 100 * class_correct[i] / class_total[i]))
- 用PyTorch训练一个图像分类 TypeError: can’t convert CUDA tensor to numpy. Use Tensor.cpu() to copy the tensor to host memory first
自己上次安装好PyTorch以及训练了一下官方的数据,今天看到了这个TensorBoard来可视化的用法,感觉不错就尝试玩了一下!自己只是尝试了一下追踪模型训练的过程,其他自己去看官网教程吧!
自己上次安装好PyTorch以及训练了一下官方的数据,今天看到了这个TensorBoard来可视化的用法,感觉不错就尝试玩了一下!自己只是尝试了一下追踪模型训练的过程,其他自己去看官网教程吧!
具体详细说明请参考https://pytorch.org/tutorials/intermediate/tensorboard_tutorial.html
具体详细说明请参考https://pytorch.org/tutorials/intermediate/tensorboard_tutorial.html
简单说就是:
- 设置TensorBoard。
-
写入TensorBoard。
-
运行
我把训练的图片分类的loss用tensorboard给可视化出来了:
我把训练的图片分类的loss用tensorboard给可视化出来了:
- 设置TensorBoard。
简单说是设置基本tensorboard运行需要的东西,我这代码中的imshow(img)和matplotlib_imshow(img, one_channel=False)都是显示图片的函数,可以统一替换,我自己测试就没改了!
# helper function to show an image
# (used in the `plot_classes_preds` function below)
def matplotlib_imshow(img, one_channel=False):
    if one_channel:
        img = img.mean(dim=0)
    img = img / 2 + 0.5     # unnormalize
    npimg = img.cpu().numpy()
    if one_channel:
        plt.imshow(npimg, cmap="Greys")
    else:
        plt.imshow(np.transpose(npimg, (1, 2, 0)))

# 设置tensorBoard
# default `log_dir` is "runs" - we'll be more specific here
writer = SummaryWriter('runs/image_classify_tensorboard')

# get some random training images
dataiter = iter(trainloader)
images, labels = dataiter.next()

# create grid of images
img_grid = torchvision.utils.make_grid(images)

# show images
# matplotlib_imshow(img_grid, one_channel=True)
imshow(img_grid)

# write to tensorboard
writer.add_image('imag_classify', img_grid)

# Tracking model training with TensorBoard
# helper functions

def images_to_probs(net, images):
    '''
    Generates predictions and corresponding probabilities from a trained
    network and a list of images
    '''
    output = net(images)
    # convert output probabilities to predicted class
    _, preds_tensor = torch.max(output, 1)
    # preds = np.squeeze(preds_tensor.numpy())
    preds = np.squeeze(preds_tensor.cpu().numpy())
    return preds, [F.softmax(el, dim=0)[i].item() for i, el in zip(preds, output)]


def plot_classes_preds(net, images, labels):
    '''
    Generates matplotlib Figure using a trained network, along with images
    and labels from a batch, that shows the network's top prediction along
    with its probability, alongside the actual label, coloring this
    information based on whether the prediction was correct or not.
    Uses the "images_to_probs" function.
    '''
    preds, probs = images_to_probs(net, images)
    # plot the images in the batch, along with predicted and true labels
    fig = plt.figure(figsize=(12, 48))
    for idx in np.arange(4):
        ax = fig.add_subplot(1, 4, idx+1, xticks=[], yticks=[])
        matplotlib_imshow(images[idx], one_channel=True)
        ax.set_title("{0}, {1:.1f}%\n(label: {2})".format(
            classes[preds[idx]],
            probs[idx] * 100.0,
            classes[labels[idx]]),
                    color=("green" if preds[idx]==labels[idx].item() else "red"))
    return fig
- 写入TensorBoard。
这个在训练的每一阶段写入tensorboard
        if i % 2000 == 1999:    # print every 2000 mini-batches
            print('[%d, %5d] loss: %.3f' %
                  (epoch + 1, i + 1, running_loss / 2000))

            # 把数据写入tensorflow
            # ...log the running loss
            writer.add_scalar('image training loss',
                            running_loss / 2000,
                            epoch * len(trainloader) + i)

            # ...log a Matplotlib Figure showing the model's predictions on a
            # random mini-batch
            writer.add_figure('predictions vs. actuals',
                            plot_classes_preds(net, inputs, labels),
                            global_step=epoch * len(trainloader) + i)
- 运行
tensorboard --logdir=runs
简单说是设置基本tensorboard运行需要的东西,我这代码中的imshow(img)和matplotlib_imshow(img, one_channel=False)都是显示图片的函数,可以统一替换,我自己测试就没改了!
# helper function to show an image
# (used in the `plot_classes_preds` function below)
def matplotlib_imshow(img, one_channel=False):
if one_channel:
img = img.mean(dim=0)
img = img / 2 + 0.5 # unnormalize
npimg = img.cpu().numpy()
if one_channel:
plt.imshow(npimg, cmap="Greys")
else:
plt.imshow(np.transpose(npimg, (1, 2, 0)))
# 设置tensorBoard
# default `log_dir` is "runs" - we'll be more specific here
writer = SummaryWriter('runs/image_classify_tensorboard')
# get some random training images
dataiter = iter(trainloader)
images, labels = dataiter.next()
# create grid of images
img_grid = torchvision.utils.make_grid(images)
# show images
# matplotlib_imshow(img_grid, one_channel=True)
imshow(img_grid)
# write to tensorboard
writer.add_image('imag_classify', img_grid)
# Tracking model training with TensorBoard
# helper functions
def images_to_probs(net, images):
'''
Generates predictions and corresponding probabilities from a trained
network and a list of images
'''
output = net(images)
# convert output probabilities to predicted class
_, preds_tensor = torch.max(output, 1)
# preds = np.squeeze(preds_tensor.numpy())
preds = np.squeeze(preds_tensor.cpu().numpy())
return preds, [F.softmax(el, dim=0)[i].item() for i, el in zip(preds, output)]
def plot_classes_preds(net, images, labels):
'''
Generates matplotlib Figure using a trained network, along with images
and labels from a batch, that shows the network's top prediction along
with its probability, alongside the actual label, coloring this
information based on whether the prediction was correct or not.
Uses the "images_to_probs" function.
'''
preds, probs = images_to_probs(net, images)
# plot the images in the batch, along with predicted and true labels
fig = plt.figure(figsize=(12, 48))
for idx in np.arange(4):
ax = fig.add_subplot(1, 4, idx+1, xticks=[], yticks=[])
matplotlib_imshow(images[idx], one_channel=True)
ax.set_title("{0}, {1:.1f}%\n(label: {2})".format(
classes[preds[idx]],
probs[idx] * 100.0,
classes[labels[idx]]),
color=("green" if preds[idx]==labels[idx].item() else "red"))
return fig
这个在训练的每一阶段写入tensorboard
if i % 2000 == 1999: # print every 2000 mini-batches
print('[%d, %5d] loss: %.3f' %
(epoch + 1, i + 1, running_loss / 2000))
# 把数据写入tensorflow
# ...log the running loss
writer.add_scalar('image training loss',
running_loss / 2000,
epoch * len(trainloader) + i)
# ...log a Matplotlib Figure showing the model's predictions on a
# random mini-batch
writer.add_figure('predictions vs. actuals',
plot_classes_preds(net, inputs, labels),
global_step=epoch * len(trainloader) + i)
tensorboard --logdir=runs
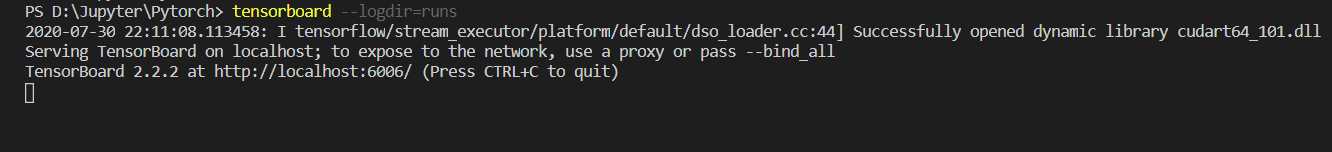
- 打开http://localhost:6006/ 即可查看

import torch
import torchvision
import torchvision.transforms as transforms
import matplotlib.pyplot as plt
import numpy as np
import torch.nn as nn
import torch.nn.functional as F
import torch.optim as optim
from datetime import datetime
from torch.utils.tensorboard import SummaryWriter

PATH = './cifar_net_100.pth'  # 保存模型地址

transform = transforms.Compose(
    [transforms.ToTensor(),
     transforms.Normalize((0.5, 0.5, 0.5), (0.5, 0.5, 0.5))])

trainset = torchvision.datasets.CIFAR10(root='./data', train=True,
                                        download=True, transform=transform)
trainloader = torch.utils.data.DataLoader(trainset, batch_size=4,
                                          shuffle=True, num_workers=0)

testset = torchvision.datasets.CIFAR10(root='./data', train=False,
                                       download=True, transform=transform)
testloader = torch.utils.data.DataLoader(testset, batch_size=4,
                                         shuffle=False, num_workers=0)

classes = ('plane', 'car', 'bird', 'cat',
           'deer', 'dog', 'frog', 'horse', 'ship', 'truck')


device = torch.device("cuda:0" if torch.cuda.is_available() else "cpu")

# Assuming that we are on a CUDA machine, this should print a CUDA device:

print(device)

print("获取一些随机训练数据")
# get some random training images
dataiter = iter(trainloader)
images, labels = dataiter.next()


# functions to show an image
def imshow(img):
    img = img / 2 + 0.5     # unnormalize
    npimg = img.numpy()
    plt.imshow(np.transpose(npimg, (1, 2, 0)))
    plt.show()

# helper function to show an image
# (used in the `plot_classes_preds` function below)
def matplotlib_imshow(img, one_channel=False):
    if one_channel:
        img = img.mean(dim=0)
    img = img / 2 + 0.5     # unnormalize
    npimg = img.cpu().numpy()
    if one_channel:
        plt.imshow(npimg, cmap="Greys")
    else:
        plt.imshow(np.transpose(npimg, (1, 2, 0)))


# show images
imshow(torchvision.utils.make_grid(images))
# print labels
print(' '.join('%5s' % classes[labels[j]] for j in range(4)))
print("**********************")

class Net(nn.Module):
    def __init__(self):
        super(Net, self).__init__()
        self.conv1 = nn.Conv2d(3, 100, 5)
        self.pool = nn.MaxPool2d(2, 2)
        self.conv2 = nn.Conv2d(100, 16, 5)
        self.fc1 = nn.Linear(16 * 5 * 5, 120)
        self.fc2 = nn.Linear(120, 84)
        self.fc3 = nn.Linear(84, 10)

    def forward(self, x):
        x = self.pool(F.relu(self.conv1(x)))
        x = self.pool(F.relu(self.conv2(x)))
        x = x.view(-1, 16 * 5 * 5)
        x = F.relu(self.fc1(x))
        x = F.relu(self.fc2(x))
        x = self.fc3(x)
        return x

net = Net()
net.to(device)


# 训练
print("训练")
criterion = nn.CrossEntropyLoss()
optimizer = optim.SGD(net.parameters(), lr=0.001, momentum=0.9)


# 设置tensorBoard
# default `log_dir` is "runs" - we'll be more specific here
writer = SummaryWriter('runs/image_classify_tensorboard')

# get some random training images
dataiter = iter(trainloader)
images, labels = dataiter.next()

# create grid of images
img_grid = torchvision.utils.make_grid(images)

# show images
# matplotlib_imshow(img_grid, one_channel=True)
imshow(img_grid)

# write to tensorboard
writer.add_image('imag_classify', img_grid)

# Tracking model training with TensorBoard
# helper functions

def images_to_probs(net, images):
    '''
    Generates predictions and corresponding probabilities from a trained
    network and a list of images
    '''
    output = net(images)
    # convert output probabilities to predicted class
    _, preds_tensor = torch.max(output, 1)
    # preds = np.squeeze(preds_tensor.numpy())
    preds = np.squeeze(preds_tensor.cpu().numpy())
    return preds, [F.softmax(el, dim=0)[i].item() for i, el in zip(preds, output)]


def plot_classes_preds(net, images, labels):
    '''
    Generates matplotlib Figure using a trained network, along with images
    and labels from a batch, that shows the network's top prediction along
    with its probability, alongside the actual label, coloring this
    information based on whether the prediction was correct or not.
    Uses the "images_to_probs" function.
    '''
    preds, probs = images_to_probs(net, images)
    # plot the images in the batch, along with predicted and true labels
    fig = plt.figure(figsize=(12, 48))
    for idx in np.arange(4):
        ax = fig.add_subplot(1, 4, idx+1, xticks=[], yticks=[])
        matplotlib_imshow(images[idx], one_channel=True)
        ax.set_title("{0}, {1:.1f}%\n(label: {2})".format(
            classes[preds[idx]],
            probs[idx] * 100.0,
            classes[labels[idx]]),
                    color=("green" if preds[idx]==labels[idx].item() else "red"))
    return fig


startTime = datetime.now()
for epoch in range(5):  # loop over the dataset multiple times
    running_loss = 0.0
    for i, data in enumerate(trainloader, 0):
        # get the inputs; data is a list of [inputs, labels]
#         inputs, labels = data

        inputs, labels = data[0].to(device), data[1].to(device)

        # zero the parameter gradients
        optimizer.zero_grad()

        # forward + backward + optimize
        outputs = net(inputs)
        loss = criterion(outputs, labels)
        loss.backward()
        optimizer.step()

        # print statistics
        running_loss += loss.item()
        if i % 2000 == 1999:    # print every 2000 mini-batches
            print('[%d, %5d] loss: %.3f' %
                  (epoch + 1, i + 1, running_loss / 2000))

            # 把数据写入tensorflow
            # ...log the running loss
            writer.add_scalar('image training loss',
                            running_loss / 2000,
                            epoch * len(trainloader) + i)

            # ...log a Matplotlib Figure showing the model's predictions on a
            # random mini-batch
            writer.add_figure('predictions vs. actuals',
                            plot_classes_preds(net, inputs, labels),
                            global_step=epoch * len(trainloader) + i)

            running_loss = 0.0

torch.save(net.state_dict(), PATH)

print('Finished Training')
print("Time taken:", datetime.now() - startTime)
print("***************************")


#获取一些随机测试数据
print("获取一些随机测试数据")
dataiter = iter(testloader)
images, labels = dataiter.next()

# print images
imshow(torchvision.utils.make_grid(images))
print('GroundTruth: ', ' '.join('%5s' % classes[labels[j]] for j in range(4)))

# 恢复模型并测试
net = Net()
net.load_state_dict(torch.load(PATH))

outputs = net(images)

_, predicted = torch.max(outputs, 1)

print('Predicted: ', ' '.join('%5s' % classes[predicted[j]]
                              for j in range(4)))

print("**********************")
print("输出训练得到的准确度")
# 输出训练得到的准确度
correct = 0
total = 0
with torch.no_grad():
    for data in testloader:
        images, labels = data
        outputs = net(images)
        _, predicted = torch.max(outputs.data, 1)
        total += labels.size(0)
        correct += (predicted == labels).sum().item()

print('Accuracy of the network on the 10000 test images: %d %%' % (
    100 * correct / total))

class_correct = list(0. for i in range(10))
class_total = list(0. for i in range(10))
with torch.no_grad():
    for data in testloader:
        images, labels = data
        outputs = net(images)
        _, predicted = torch.max(outputs, 1)
        c = (predicted == labels).squeeze()
        for i in range(4):
            label = labels[i]
            class_correct[label] += c[i].item()
            class_total[label] += 1

for i in range(10):
    print('Accuracy of %5s : %2d %%' % (
        classes[i], 100 * class_correct[i] / class_total[i]))
import torch
import torchvision
import torchvision.transforms as transforms
import matplotlib.pyplot as plt
import numpy as np
import torch.nn as nn
import torch.nn.functional as F
import torch.optim as optim
from datetime import datetime
from torch.utils.tensorboard import SummaryWriter
PATH = './cifar_net_100.pth' # 保存模型地址
transform = transforms.Compose(
[transforms.ToTensor(),
transforms.Normalize((0.5, 0.5, 0.5), (0.5, 0.5, 0.5))])
trainset = torchvision.datasets.CIFAR10(root='./data', train=True,
download=True, transform=transform)
trainloader = torch.utils.data.DataLoader(trainset, batch_size=4,
shuffle=True, num_workers=0)
testset = torchvision.datasets.CIFAR10(root='./data', train=False,
download=True, transform=transform)
testloader = torch.utils.data.DataLoader(testset, batch_size=4,
shuffle=False, num_workers=0)
classes = ('plane', 'car', 'bird', 'cat',
'deer', 'dog', 'frog', 'horse', 'ship', 'truck')
device = torch.device("cuda:0" if torch.cuda.is_available() else "cpu")
# Assuming that we are on a CUDA machine, this should print a CUDA device:
print(device)
print("获取一些随机训练数据")
# get some random training images
dataiter = iter(trainloader)
images, labels = dataiter.next()
# functions to show an image
def imshow(img):
img = img / 2 + 0.5 # unnormalize
npimg = img.numpy()
plt.imshow(np.transpose(npimg, (1, 2, 0)))
plt.show()
# helper function to show an image
# (used in the `plot_classes_preds` function below)
def matplotlib_imshow(img, one_channel=False):
if one_channel:
img = img.mean(dim=0)
img = img / 2 + 0.5 # unnormalize
npimg = img.cpu().numpy()
if one_channel:
plt.imshow(npimg, cmap="Greys")
else:
plt.imshow(np.transpose(npimg, (1, 2, 0)))
# show images
imshow(torchvision.utils.make_grid(images))
# print labels
print(' '.join('%5s' % classes[labels[j]] for j in range(4)))
print("**********************")
class Net(nn.Module):
def __init__(self):
super(Net, self).__init__()
self.conv1 = nn.Conv2d(3, 100, 5)
self.pool = nn.MaxPool2d(2, 2)
self.conv2 = nn.Conv2d(100, 16, 5)
self.fc1 = nn.Linear(16 * 5 * 5, 120)
self.fc2 = nn.Linear(120, 84)
self.fc3 = nn.Linear(84, 10)
def forward(self, x):
x = self.pool(F.relu(self.conv1(x)))
x = self.pool(F.relu(self.conv2(x)))
x = x.view(-1, 16 * 5 * 5)
x = F.relu(self.fc1(x))
x = F.relu(self.fc2(x))
x = self.fc3(x)
return x
net = Net()
net.to(device)
# 训练
print("训练")
criterion = nn.CrossEntropyLoss()
optimizer = optim.SGD(net.parameters(), lr=0.001, momentum=0.9)
# 设置tensorBoard
# default `log_dir` is "runs" - we'll be more specific here
writer = SummaryWriter('runs/image_classify_tensorboard')
# get some random training images
dataiter = iter(trainloader)
images, labels = dataiter.next()
# create grid of images
img_grid = torchvision.utils.make_grid(images)
# show images
# matplotlib_imshow(img_grid, one_channel=True)
imshow(img_grid)
# write to tensorboard
writer.add_image('imag_classify', img_grid)
# Tracking model training with TensorBoard
# helper functions
def images_to_probs(net, images):
'''
Generates predictions and corresponding probabilities from a trained
network and a list of images
'''
output = net(images)
# convert output probabilities to predicted class
_, preds_tensor = torch.max(output, 1)
# preds = np.squeeze(preds_tensor.numpy())
preds = np.squeeze(preds_tensor.cpu().numpy())
return preds, [F.softmax(el, dim=0)[i].item() for i, el in zip(preds, output)]
def plot_classes_preds(net, images, labels):
'''
Generates matplotlib Figure using a trained network, along with images
and labels from a batch, that shows the network's top prediction along
with its probability, alongside the actual label, coloring this
information based on whether the prediction was correct or not.
Uses the "images_to_probs" function.
'''
preds, probs = images_to_probs(net, images)
# plot the images in the batch, along with predicted and true labels
fig = plt.figure(figsize=(12, 48))
for idx in np.arange(4):
ax = fig.add_subplot(1, 4, idx+1, xticks=[], yticks=[])
matplotlib_imshow(images[idx], one_channel=True)
ax.set_title("{0}, {1:.1f}%\n(label: {2})".format(
classes[preds[idx]],
probs[idx] * 100.0,
classes[labels[idx]]),
color=("green" if preds[idx]==labels[idx].item() else "red"))
return fig
startTime = datetime.now()
for epoch in range(5): # loop over the dataset multiple times
running_loss = 0.0
for i, data in enumerate(trainloader, 0):
# get the inputs; data is a list of [inputs, labels]
# inputs, labels = data
inputs, labels = data[0].to(device), data[1].to(device)
# zero the parameter gradients
optimizer.zero_grad()
# forward + backward + optimize
outputs = net(inputs)
loss = criterion(outputs, labels)
loss.backward()
optimizer.step()
# print statistics
running_loss += loss.item()
if i % 2000 == 1999: # print every 2000 mini-batches
print('[%d, %5d] loss: %.3f' %
(epoch + 1, i + 1, running_loss / 2000))
# 把数据写入tensorflow
# ...log the running loss
writer.add_scalar('image training loss',
running_loss / 2000,
epoch * len(trainloader) + i)
# ...log a Matplotlib Figure showing the model's predictions on a
# random mini-batch
writer.add_figure('predictions vs. actuals',
plot_classes_preds(net, inputs, labels),
global_step=epoch * len(trainloader) + i)
running_loss = 0.0
torch.save(net.state_dict(), PATH)
print('Finished Training')
print("Time taken:", datetime.now() - startTime)
print("***************************")
#获取一些随机测试数据
print("获取一些随机测试数据")
dataiter = iter(testloader)
images, labels = dataiter.next()
# print images
imshow(torchvision.utils.make_grid(images))
print('GroundTruth: ', ' '.join('%5s' % classes[labels[j]] for j in range(4)))
# 恢复模型并测试
net = Net()
net.load_state_dict(torch.load(PATH))
outputs = net(images)
_, predicted = torch.max(outputs, 1)
print('Predicted: ', ' '.join('%5s' % classes[predicted[j]]
for j in range(4)))
print("**********************")
print("输出训练得到的准确度")
# 输出训练得到的准确度
correct = 0
total = 0
with torch.no_grad():
for data in testloader:
images, labels = data
outputs = net(images)
_, predicted = torch.max(outputs.data, 1)
total += labels.size(0)
correct += (predicted == labels).sum().item()
print('Accuracy of the network on the 10000 test images: %d %%' % (
100 * correct / total))
class_correct = list(0. for i in range(10))
class_total = list(0. for i in range(10))
with torch.no_grad():
for data in testloader:
images, labels = data
outputs = net(images)
_, predicted = torch.max(outputs, 1)
c = (predicted == labels).squeeze()
for i in range(4):
label = labels[i]
class_correct[label] += c[i].item()
class_total[label] += 1
for i in range(10):
print('Accuracy of %5s : %2d %%' % (
classes[i], 100 * class_correct[i] / class_total[i]))